Our client is a global manufacturing leader operating in the agribusiness space dedicated to bringing fresh foods to America’s dinner tables. For this engagement, the POWERS team focused on one of their facilities that provides fertilizer to commercial landscapers and agricultural growers. Located in one of the country’s largest production centers for fruits and vegetables, this facility has been operating for decades producing high-quality fertilizer for professionals in agriculture, the turf trade, nurseries, the feed business, and industrial use.

Project Overview

Performance Results
Situation
Despite a long-ranging history of success, our client entered each of the last three busy Spring seasons behind due to poor production throughput and equipment reliability issues. Starting their busiest time of year behind led to struggling to keep up with seasonal customer demand and to meet customer orders on time.
Many last-minute events cascaded each year into poor production and scheduling decisions, leaving them scrambling at the last minute. There were frequent abrupt schedule changes because customer orders due to be picked up had yet to be produced. This led to emergency schedule breaks to fulfill customer orders, sometimes with trucks waiting.
Constant and last-minute schedule changes lead to confusion among employees and supervision (what are we supposed to make because word of the last-minute change may not have been communicated to all employees), inefficient production runs incurred due to short/small production quantities (only making minimum amounts because that is what was shipping “today” rather than running the total amount needed for the week/month because they needed to make the following product “shipping today”) and increased downtime due to inefficiencies and multiple changeovers per shift.
In addition, our team uncovered that:
- Management needed visibility into what was and was not happening in the department (good or bad).
- The department is unique to the rest of the division, so adopting processes from other areas or plants was not viable.
- Employees, supervisors, and managers had become numb to underperformance. There was no urgency when a line was down.
- Accurate reporting was absent in the department. Therefore, quantifying the many situational challenges to drive improvements proved challenging.
POWERS Helps One of the World’s Largest Agribusiness Manufacturers Improve Throughput by 24% and Uptime by 11%
Background
Our client is a global manufacturing agribusiness leader operating in the agribusiness space dedicated to bringing fresh foods to America’s dinner tables. For this engagement, the POWERS team focused on one of their facilities that provides fertilizer to commercial landscapers and agricultural growers. Located in one of the country’s largest production centers for fruits and vegetables in the United States, this facility has been operating for decades producing high-quality fertilizer for professionals in agriculture, the turf trade, nurseries, the feed business, and industrial use.
Situation
Despite a long-ranging history of success, our client entered each of the last three busy Spring seasons behind due to poor production throughput and equipment reliability issues. Starting their busiest time of year behind led to struggling to keep up with seasonal customer demand and to meet customer orders on time.
Many last-minute events cascaded each year into poor production and scheduling decisions, leaving them scrambling at the last minute. There were frequent abrupt schedule changes because customer orders due to be picked up had yet to be produced. This led to emergency schedule breaks to fulfill customer orders, sometimes with trucks waiting.
Constant and last-minute schedule changes lead to confusion among employees and supervision (what are we supposed to make because word of the last-minute change may not have been communicated to all employees), inefficient production runs incurred due to short/small production quantities (only making minimum amounts because that is what was shipping “today” rather than running the total amount needed for the week/month because they needed to make the following product "shipping today") and increased downtime due to inefficiencies and multiple changeovers per shift.
In addition, our team uncovered that:
- Management needed visibility into what was and was not happening in the department (good or bad).
- The department is unique to the rest of the division, so adopting processes from other areas or plants was not viable.
- Employees, supervisors, and managers had become numb to underperformance. There was no urgency when a line was down.
- Accurate reporting was absent in the department. Therefore, quantifying the many situational challenges to drive improvements proved challenging.
Analysis
- A critical piece of the production line (Compacta bagger) was not running at the desired rate (40 tons per hour), which is less than the manufacturer's designed rates (50 tons per hour). Observed rates were less than 30 tons per hour. 75% of the desired rate, 60% of the manufacturer's designed rate, and was observed to be down 50% of the planned run time. 23% for mechanical, 27% for non-mechanical
- An additional vital piece of machinery (Bemis bagger) was not running at the desired rate (30 tons per hour) and was observed running at 24 tons per hour. This rate was 80% of the desired rate, down 57% of the planned mechanical run time, and an additional 12% for non-mechanical.
- Poor Startup Scores Compacta was 56%. Bemis was 11%!
- Confirmed lack of understanding of “what was actually happening.”
- There were no coordinated efforts with maintenance to plan work or reduce downtime.
- Excessive scrap levels from the Bemis bagger had become normalized to employees, with no efforts to improve or eliminate waste. Scrap was not being measured. Rework was not being measured.
- The Gal-Xe line did not have a schedule, no expectations for daily throughput were provided to employees, and how long each production run of a SKU was going to take was unknown.
Solution
- Our team implemented Startup Scorecards. The Production Supervisor filled it out daily and was on the production floor for the entire first hour of production. In addition, the Maintenance team dedicated a mechanic to the line for the first two hours of scheduled production each day.
- For "visibility" to performance, implemented Start Up Scorecard (visibility to the first hour of the day performance), Daily Schedule Control (visibility to hourly production versus plan with documented downtime minutes and cause), Downtime Pareto Charts (visibility to downtime by top cause and occurrence for each line/machine), Daily Weekly Operating Report (visibility to daily and weekly performance versus the plan and goal)
- For alignment and accountability implemented, the following communication points: Start Up Review Meeting (to ensure a successful startup was had and ensure actions were being taken against barriers to performance), Daily Review Meeting (to review current day’s performance versus the plan and review the plan for tomorrow), Weekly Review Meeting (to review prior week’s performance versus the plan between Plant Manager and Department Managers and assign Action Items for barriers to performance) Maintenance Coordination Meeting (to review Downtime Pareto Charts with Maintenance so work can be planned on equipment causing the most downtime)
- Completed next week’s schedule by COB Wednesday of the current week; aligned with maintenance line availability so maintenance work could be done when a line is not scheduled. Incorporated historical performance into planning to ensure a full production shift was scheduled rather than generic daily targets.
- We began measuring Scrap and Rework daily.
- We implemented a schedule for the Gal-Xe line. Projected out how long each batch would take based on SKU, thus calculating how long each SKU would run before the next changeover. Expectations were then provided to employees for how many batches they were expected to make each shift.
Results
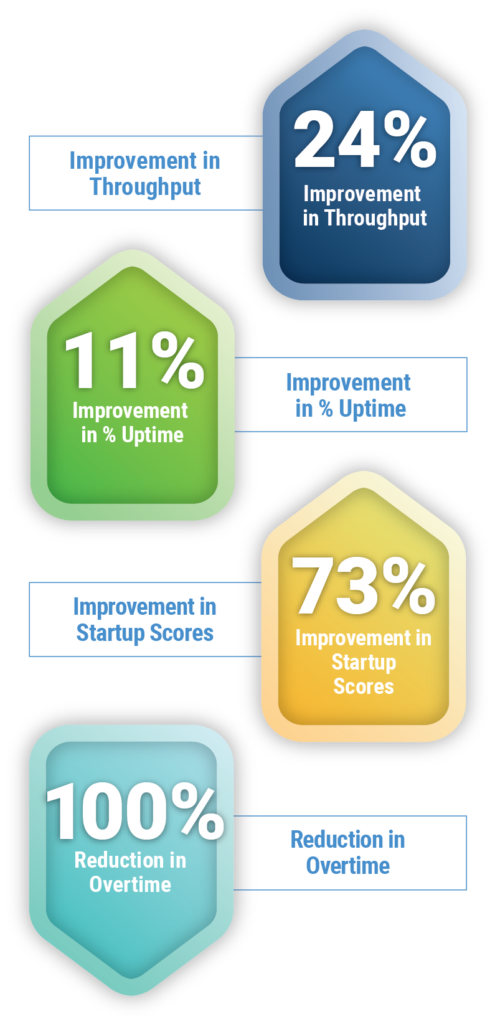
- 24% Improvement in Throughput
- Throughput improvements: In week 6 of the project, averaged 266 tons per day versus a baseline of 214, a 24% improvement in weekly throughput. This result is compounded by the baseline period of 10-hour shifts versus only 8-hour ones during the project.
- 11% Improvement in % Uptime
- 77% last four weeks of the project versus 69% first four weeks measured (this was never measured before the engagement).
- 73% Improvement in Startup Scores
- Startup scores Compacta averaged 97% startup scores for the last four weeks of the project, from 56% at the start.
- Bemis averaged 78% startup scores over the last four weeks of the project, from 11% at the beginning.
- Averaged 102% Schedule Attainment
- Averaged 102% schedule attainment over the last four weeks of the project.
- 100% Reduction in Overtime
- Reduced OT (overtime) to zero (0) hrs.
- Reduced Weekly Production Hours
- Weekly production was also curtailed by 8 hours for inventory control.