
Root Cause Analysis (RCA) is a critical practice in manufacturing, helping organizations identify, address, and prevent problems that impact productivity and quality. The simple, yet highly effective Fishbone Diagram is a vital tool in the RCA toolbox.
What is a Fishbone Diagram?
The Fishbone Diagram, also known as the Ishikawa Diagram or Cause-and-Effect Diagram, is a powerful tool for root cause analysis in manufacturing. Developed by Dr. Kaoru Ishikawa, this visual aid helps teams systematically identify and categorize potential causes of a problem, resembling a fish skeleton with the issue at the “head” and causes branching out as “bones.”
This structured approach ensures a thorough exploration of all factors contributing to manufacturing challenges, such as defects or inefficiencies, making it a cornerstone of manufacturing problem-solving.
This Fishbone Diagram structure helps teams systematically explore all aspects of a problem, ensuring a thorough analysis.
Benefits of Using Fishbone Diagrams in Manufacturing
Implementing the Fishbone Diagram offers numerous advantages for manufacturing teams:
- Comprehensive Analysis: Identifies all potential causes across multiple categories, ensuring no factor is overlooked.
- Team Collaboration: Encourages cross-functional input, fostering teamwork and diverse perspectives.
- Visual Clarity: Simplifies complex problems with an intuitive, easy-to-understand structure.
- Proactive Problem Solving: Helps prevent recurring issues by addressing root causes, not just symptoms.
- Improved Quality: Supports quality control in manufacturing by reducing defects and optimizing processes.
Major Categories in a Fishbone Diagram
In manufacturing, Fishbone Diagrams typically use the following categories to organize potential causes:
- Manpower: Issues related to workforce skills, training, or performance.
- Methods: Problems with processes, procedures, or workflows.
- Machines: Equipment malfunctions, maintenance issues, or outdated technology.
- Materials: Quality issues with raw materials or supplies.
- Measurements: Errors in data collection, metrics, or quality checks.
- Environment: External factors like temperature, humidity, or workplace conditions.
These categories can be customized to suit specific manufacturing challenges, ensuring flexibility in root cause analysis.
How to Create a Fishbone Diagram: Step-by-Step Guide
Follow these steps to create an effective Fishbone Diagram for manufacturing process improvement:
1Identify the Problem
Define a specific issue, such as “High defect rate in widget production.” A clear problem statement keeps the analysis focused.
2Assemble the Team
Gather a cross-functional team, including production, quality control, and maintenance staff, to ensure diverse insights.
3Draw the Backbone
Create the fishbone structure with the problem at the head and major categories branching out.
4Identify Major Categories
Use standard categories or tailor them to the problem’s context.
5Brainstorm Potential Causes
Encourage open discussion to list all possible causes under each ca
6Populate the Diagram
Add causes as sub-branches, organizing them logically for clarity.
7Analyze and Prioritize Causes
Use tools like the 5 Whys Technique to identify root causes and prioritize them based on impact.
Fishbone Diagram Example in Manufacturing
Consider this scenario: A manufacturing plant faces a high defect rate in its widget production line.
Problem Identification and Team Assembly
Problem: “High defect rate in the widget production line.”
Team: Production manager, quality control inspector, machine operator, and maintenance technician.
Category Identification and Brainstorming
- Manpower: Insufficient training, operator fatigue. These factors could lead to mistakes and inconsistencies in production.
- Methods: Inconsistent procedures, lack of standardization. Variability in processes can result in inconsistent product quality.
- Machines: Worn-out parts, calibration issues. Equipment problems can directly impact the quality of the produced widgets.
- Materials: Substandard raw materials, inconsistent supplier quality. The quality of materials used can greatly impact the final product.
- Measurements: Inaccurate gauges, infrequent inspections. Reliable measurement systems are essential for maintaining quality control.
- Environment: Poor lighting, high humidity. Environmental conditions can affect both the production process and the workers' performance.
Diagram Creation and Cause Analysis
The team creates a Fishbone Diagram, categorizing causes under Manpower, Methods, Machines, Materials, Measurement, and Environment. Through analysis, they identify inconsistent procedures and substandard raw materials as primary causes. Further investigation reveals supplier quality issues and the need for standardized processes.
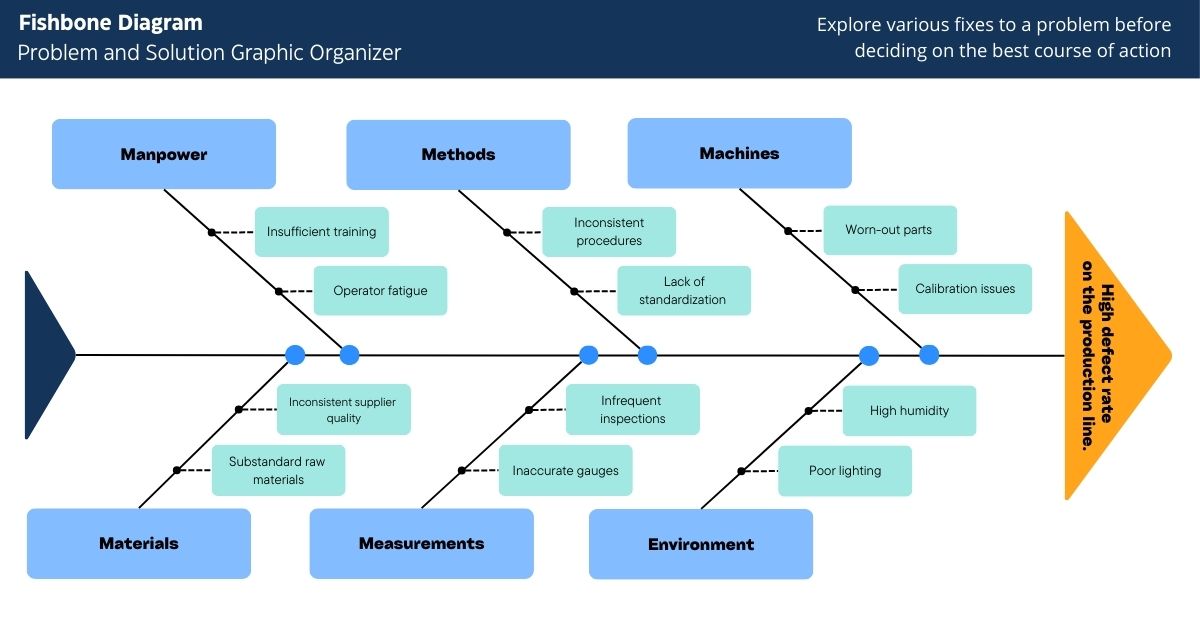
An example Fishbone diagram based the scenerio outlined above
Tips for Effective Use of Fishbone Diagrams
- Focus and Diversity: Keep the team focused and encourage diverse viewpoints. A diverse team can provide a more comprehensive analysis by considering various perspectives and expertise.
- Data and Evidence: Use data and evidence to support the identification of causes. Collect and analyze relevant data to validate the identified causes and ensure the analysis is based on factual information.
- Review and Update: Review and update the diagram as new information becomes available. Root cause analysis is a continuous process, and the diagram should be updated as new insights emerge.
- Combine Tools: Combine the Fishbone Diagram with other analysis tools for deeper insights. Techniques such as Pareto analysis, Failure Mode and Effects Analysis (FMEA), and Statistical Process Control (SPC) can complement the Fishbone Diagram and provide additional insights.
Why Choose the Fishbone Diagram for Manufacturing?
The Fishbone Diagram’s structured approach makes it ideal for tackling complex manufacturing challenges. By systematically analyzing all potential causes, teams can develop targeted solutions to improve quality, reduce defects, and enhance productivity. Pairing the diagram with other tools, like the 5 Whys, ensures deeper insights and sustainable results.
Learn more about manufacturing process optimization to complement your root cause analysis efforts.
How Powers Can Help
At POWERS Management Consulting, we specialize in helping manufacturers improve operational efficiency through expert root cause analysis and process improvements. Our team leverages tools like the Fishbone Diagram to identify and address challenges, delivering measurable results.
Our tailored approach ensures that your team gains the insights and skills necessary to drive sustainable improvements and achieve measurable results.
If you’re ready to elevate your problem-solving skills and streamline your manufacturing processes, reach out to us today for professional guidance and support.
- Speak to an Expert: Call +1 678-971-4711 to discuss your specific challenges and goals.
- Email Us: Get tailored insights by emailing info@thepowerscompany.com
- Request an Assessment: Use our online contact form, and one of our productivity experts will reach out to schedule an in-depth analysis of your operations.